


It is hard for users to understand schedule content just by looking at the scheduling results on a character-based screen. Being equipped with advanced GUI (graphical user interface) aids the user's understanding of the results. Asprova uses unified GUI chart and table displays just as Microsoft Project does. GUI allows decisions to be made intuitively on whether a schedule's results are good or bad.
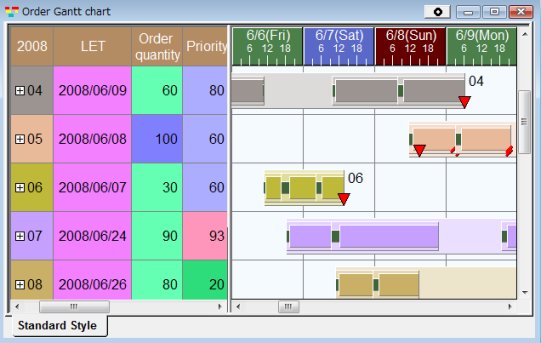
Fig. 3 Tables and time charts