


Q: How can we visualize conditional orders via computer?
A: The diagram below shows a planning string (Gantt order charts) for the Asprova Advanced Planning and Scheduling System (APS). You can see on the screen how the inventory and manufacturing orders are connected by line and observe such things as whether they will meet the delivery deadline whether they are short of raw materials which inventory they are connected to which items will start production after automatic replenishment.
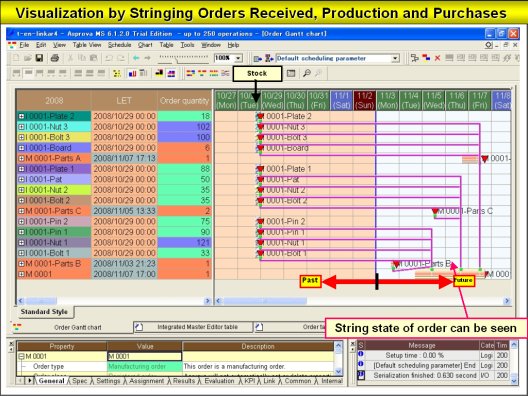
Related article : Visualizing the Production Schedule (Gantt Resource Charts)