Q: We are assigning our safety stock in article units and reducing inventories in a range so that nothing goes out of stock. Fluctuations in demand make it difficult to determine how much safety stock is reduced. Is there a method for knowing what the appropriate stock level is for each item?
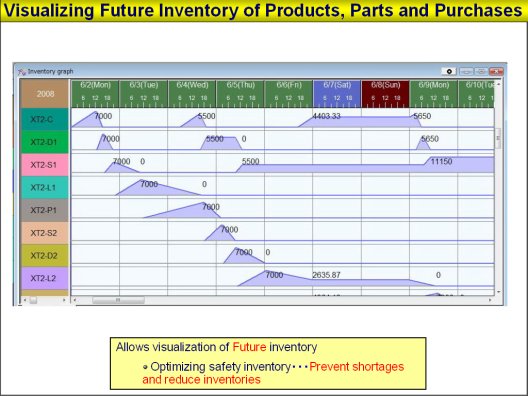
A: The results of preparing a production schedule show in an inventory graph (see below). Trends in inventory shifts both past and future can be seen for each production (complete manufactures partial manufactures and purchased goods). We can see whether there is too much or whether we barely have enough and how much the inventory is worth in monetary terms for each item so that we can manage the safety stock for each. One of the distinctive features of the Advanced Planning and Scheduling Systems inventory graph is that we can see/forecast what the inventory will be in the future. With it we can check for excessive inventories insufficient inventories and inventory value in the future.

Related articles :


