


Asprova Beginner's Lesson 3 -- Material Requirement Calcuration --
30 minutes
Learn by Movie
Download the project file of this lesson.
If you take a look to the documentation, please read the following.
What you will learn in this lesson
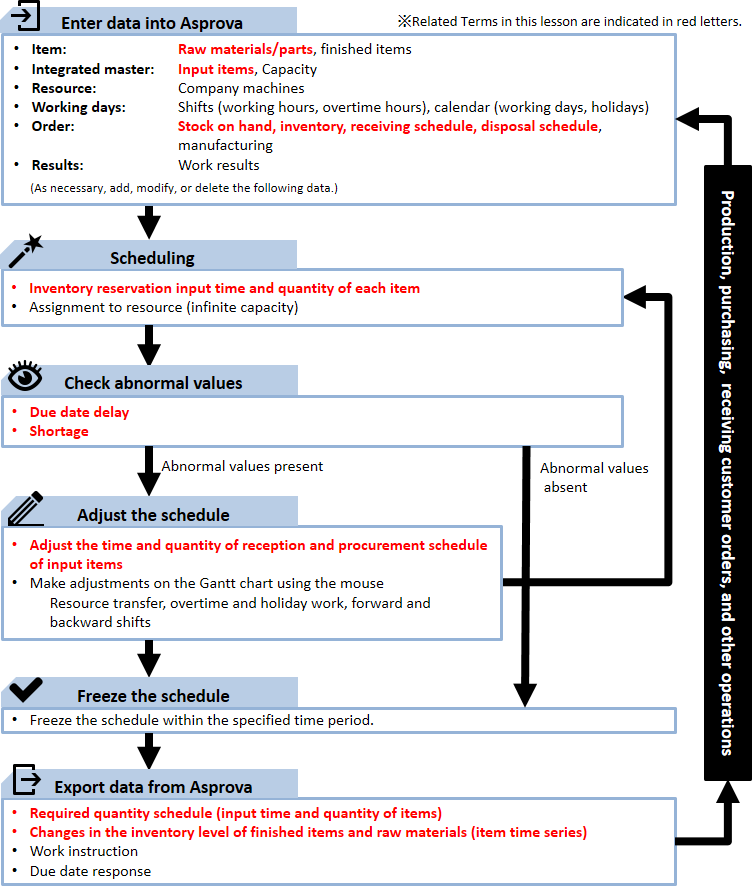
In this lesson, you will learn how to create a production schedule that takes the inventory of raw materials (hereafter referred to as input items) into account. The following figure illustrates the assumed workflow. We will make adjustments to the schedule in order to prevent due date delays and stock shortages by registering the inventory of input items and the receiving schedule. In addition to the work instructions and due date response exported in lesson 2, the required quantity and picking list of input items as well as the item time series, which represents changes in the inventory level of finished items and raw materials, will be exported from Asprova.
The contents of this lesson apply to MRP and higher modules, and the operations described here are for the MRP module. For information on how to switch the module, see "How to start Asprova"
Download the project file of this lesson.
If you have questions, please access "Q&A Center" from navigation menu of this web site.
BOM (bill of materials) used in this lesson
This lesson will describe an assembly process at the Takahashi Electric Corporation's factory in Thailand with the premise that the aforementioned workflow is performed on a daily basis.

Takahashi Electric Corporation's factory in Thailand has a process that assembles parts A and X to produce AX and a process that assembles parts B and X to produce BX. X is a common part used in both processes. (For details on the process for producing A and B, see lesson 2.)
The required quantity calculation must take into account any defective parts that may be produced and wasted materials lost because of the production process setup or adjusting machine conditions. Based on the results collected in the past, defective A and B parts are tabulated as ratios (yield rates). In the case of X, the first two pieces in every lot must be disposed, so it is tabulated as a quantity.
Let's enter this information to create a schedule.
Procedure
1. Entering Data into Asprova
1-1 Registering Input Items
First, open the Integrated Master Editor table. Item AX and BX are already registered . We will register input items A, B, and X.

- Click [Integrated Master Editor table].
■ Registration Procedure
(1) When registering items A, B, and X, set Instruction type to [Input instruction]. [Input instruction] allows you to enter information about the items that will be input in the process. The table on the right shows the information that needs to be entered.
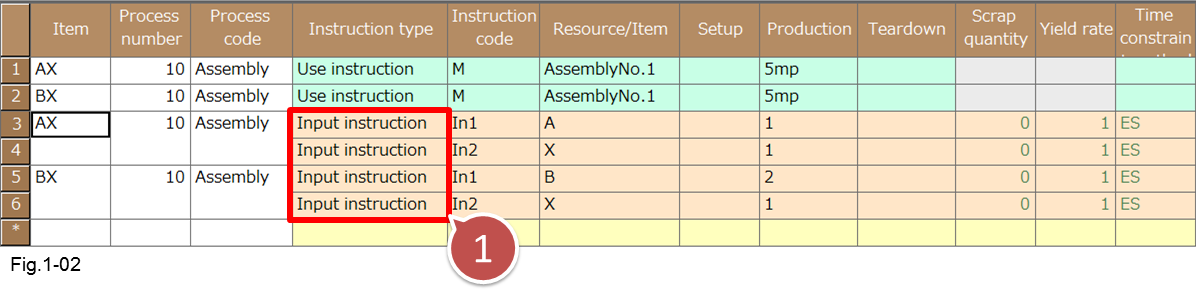
- Add new [Input instruction] rows.
● Input instruction settings
| Setting item | Description |
|---|---|
| Instruction code | Enter a character string or number for recognition. The instruction code of the input instruction is set as "In" by default. However, you can also use another arbitrary code. |
| Item/Resource | Enter the name of the item that will be input to the process. |
| Production | Specify the quantity (number) of the input item required to produce one unit of the output item. There is no need to set the unit for each input item even if the unit is different for each item. Example Producing one case of item [S100] requires 100 pieces of item [S]. -> Set [Production] to 100. |
| Yield rate | Set the yield rate of the input item. |
| Scrap quantity | Set the scrap (disposed) quantity for the input item. |

- Set the scrap quantity for the Resource/Item row X.
- Set the yield rates of items A and B.
The expression for the required quantity is as follows:
Input instruction quantity = (quantity of operations × required quantity + scrap quantity) / yield rate
You can change this expression as you like. (See "Expression" in the Intermediate Lesson.)
1-3 Registering Inventory
Next, we will set the current inventory and the future receiving schedule of the input items as inventory orders.
■ Registration Procedure
For item X, let's set the absolute quantity and fluctuation quantity. We will use the Order table. There are five manufacturing orders already registered. Let's add an inventory order.
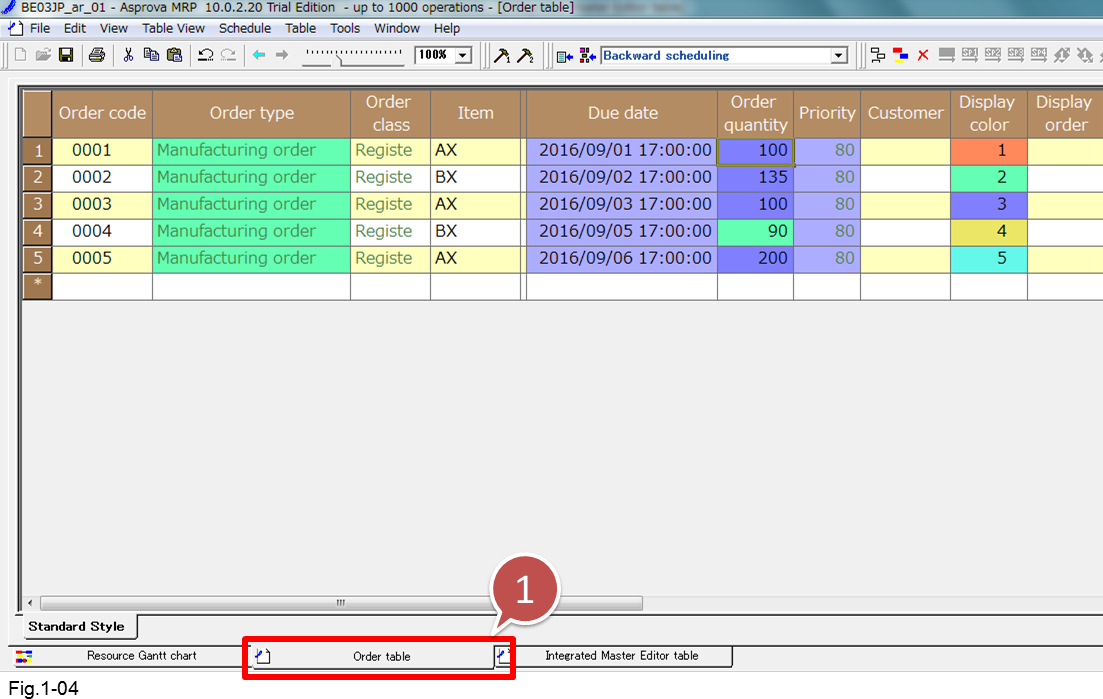
- Click Order table.
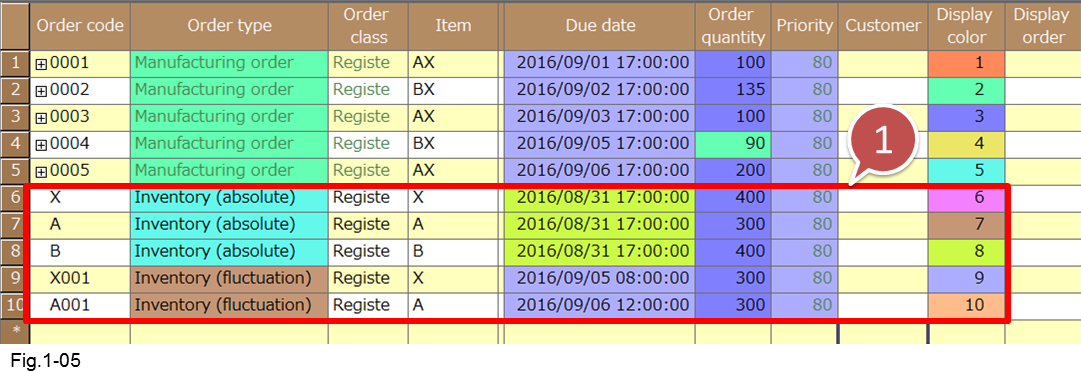
- Register inventory orders.
Inventory registration and management
In Asprova, inventories are considered to be orders, and they are managed in the Order table. As such, there is no inventory table in Asprova.
There are two types of inventory orders: absolute and fluctuation. Inventory and stock on hand are registered as absolute orders.
Register the inventory level at the time inventory or stock on hand is accounted for.
For fluctuation orders, register the quantity and the time of the scheduled reception or disposal. Set a positive order quantity for reception and a negative order quantity for disposal.
The concept of a "due date" for inventory may be a bit hard to grasp, but simply set the time relevant for that inventory event.
Since a schedule starts from the scheduling basis time, be sure to set the due date of an absolute inventory order earlier than the scheduling basis time.
In the case of a fluctuation inventory order, specify the time of the reception or disposal. Be sure to set a time that is later than the time of the absolute inventory order of the same item.
2. Scheduling
Set the scheduling parameter to [Backward scheduling], and execute a reschedule. Required quantity calculation, inventory allotment, and order assignments are executed.

- Select [Backward scheduling], and click the [Reschedule] button.

- The orders are automatically assigned.
Check the required quantity calculation and inventory reserved for use. To check the inventory of items related to a manufacturing order, select the entire row, right-click to display a pop-up menu, and click [Drilldown] and then [Inventory Graph]. The inventory graph of the input items and finished items is displayed under the selected row.
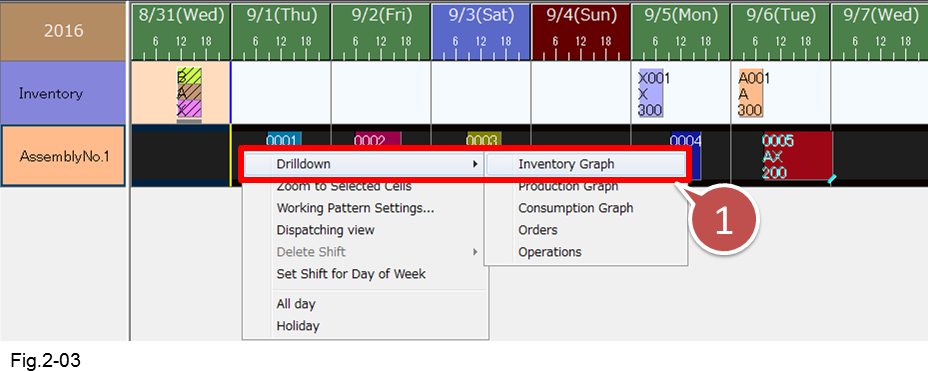
- Select the entire row, right-click to display a pop-up menu, and click [Drilldown] and then [Inventory Graph]
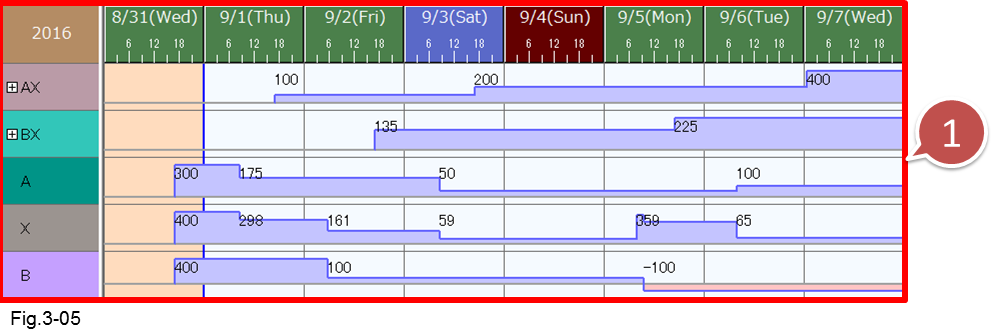
Check that the [Yield rate] and [Scrap quantity] specified for the input items have been taken into account.

- Since the [Scrap quantity] of input item X is 2, 102 items are being supplied from the inventory.
- Since the [Yield rate] of input item A is 0.8, 125 items are being supplied from the inventory.
3. Checking Abnormal Values
Check that there are no due date delays, inventory shortage or surplus.
3-1 Checking Due Date Delays
Check the details of orders whose due dates are delayed. As explained in lesson 2, use instruction bars whose text appears in red are those whose due dates are delayed.

- The text appears in red, and a red check mark is displayed at the lower right of the operation.
If inventories of input items are taken into account, due date delays may be caused by shortages of input items. Next, we will check shortages.
3-2 Checking Shortages
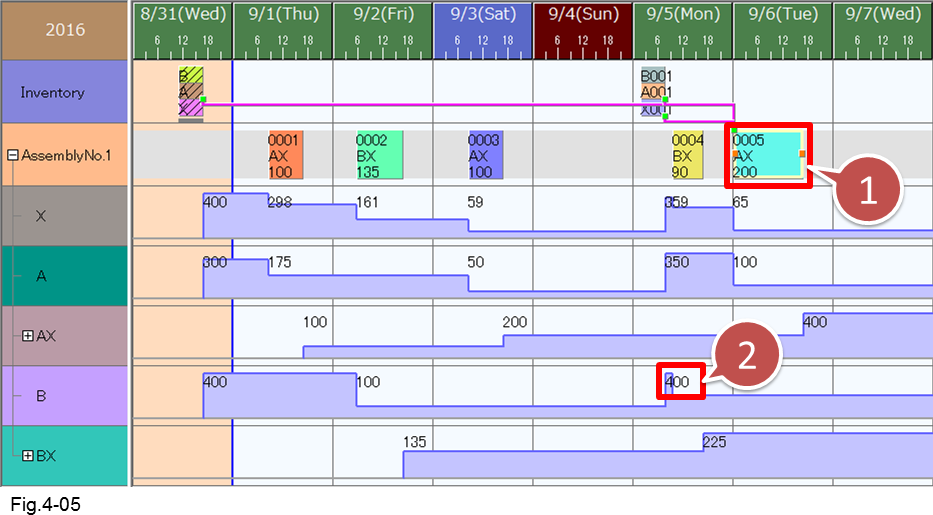
Clicking a manufacturing order [0005], whose due date is delayed, displays connection lines (pink lines). The connection lines show which inventory is reserved for a scheduled order .
We can see that the due date of manufacturing order [0005] is delayed because there is not enough item A until its reception on September 6. In such a case, adjusting the working time will not shift the due date forward because there is no inventory.

- The start of operation is delayed because the reception of item A is being waited for.
From the inventory graph, we can also see that there will be a shortage of item B. The stock on hand is 400 pieces. However, because the input quantity is greater than the inventory, it can be seen that shortage will occur from September 5.

- For item B, the required quantity is greater than the inventory, so a shortage is occurring.
If you want to view the inventory graph of all items, use the Window menu. From the [Window] menu, click [New Inventory Graph]. A [New Inventory] tab will appear.

- Click [New Inventory Graph].
- The inventory graph of all items is displayed.
Graph and chart display settings
Asprova enables you to change how graphs and charts are displayed so that you can efficiently evaluate schedules, find problems, and investigate issues. For example, it is possible to filter conditions to display only items that are in short supply.
-> For details on how to set the graph and chart displays, see "GUI" in the intermediate lesson and "GUI Overview" in the online help.
4. Adjusting the Schedule
If there are orders with due date delays, you can assign operations to different resources, shift operations forward or backward, and make other scheduling modifications.
To manually adjust the schedule, drag-and-drop Operations as described in lesson 2.

- The text appears in red, and a red check mark is displayed at the lower right of the operation.
4-1 Checking the Cause of Due Date Delay
The use instruction bars on the resource Gantt chart can be dragged to shift them forward or backward in the schedule. Manufacturing orders whose due date are delayed are indicated with red text. Let's shift these orders forward so that the due dates are met.
When we shifted the bar forward, the text turned blue. This indicates that the start time is too early. The reason is a delay in the reception of inventory, and this is preventing the operation from being shifted forward.

- Adjusting the schedule so that the due date is met changes the text color to blue.
4-2 Adjusting the Supply
If a due date is delayed for reasons such as the reception of input items being delayed, supply adjustments must be made.
■ Adjusting the Reception Timing of Input Items
(1) Manufacturing order [0005] whose due date is Tuesday, September 6, is late because the reception of inventory A is delayed and the Production End Time is Wednesday, September 7. In addition, for manufacturing order [0004], we can see that shortage of item B will occur.

- The reception of item A is delayed, and the due date of manufacturing order 0005 is delayed.
- Because the quantity of item B reserved for manufacturing order [0004] is greater than the inventory quantity, item B is a negative inventory quantity or shows a shortage.
(2) To meet the September 6 (Tuesday) due date of manufacturing order [0005], we consulted with the person in charge of production of item A and had the reception date of item A changed to September 5 (Monday). We also made adjustments so that item B would be received on September 5 (Monday). Using the Order table, let's add and change the appropriate fluctuation inventory orders.

- The time of fluctuation inventory order [A001] is changed to 8:00 on September 5.
- Fluctuation inventory order [B001] is added to relieve the shortage of item B.
(3) Execute a Reschedule, and check for due date delays and shortages.
We can see that manufacturing order [0005], whose due date used to be delayed, has been shifted forward and that the shortage of item B for manufacturing order [0004] has been relieved.
- The operation of the manufacturing order has been shifted forward to September 6 (Tuesday). Since the due date is met, the text color turns black.
- The shortage has been relieved because the reception of item B has been added.
5. Freezing the Schedule
After adjusting and checking the schedule, create instructions for manufacturing sites, and freeze the schedule.
-> See Lesson 2.
Time fence
Because of certain circumstances in the operation or systems that are synchronized to Asprova, we may set up a rule that no modifications of any kind will be accepted for N days after a schedule is frozen. The period during which no modifications are accepted is called time fence.
For example, when there is an unannounced order or production request, new orders may be assigned in a time period that has been previously frozen in the scheduler. A time fence can push these new orders back outside the time period so that the schedule within the frozen time period is secured.
In the figure below, a time fence has been set up until the 7th for a purchase schedule.
-> For details on setting time fences, see Lesson 10 and Lesson 11.

- Fig.5-01 Before setting a time fence
- Fig.5-02 After setting time fence
- The schedule up to June 7 has been protected with a time fence.
6. Exporting Data from Asprova
After freezing a schedule, check the data necessary for generating instructions and export it.
6-1 Exporting Instructions
■ Instruction export procedure
(1) To create instructions, on the [File] menu, click [Export]. Schedule data files are exported in the project folder.

- Click [Export].
(2) Open the project folder, and check the exported files. The following instruction files are exported.
- Due date response
-> order.tbl (manufacturing orders) - Required quantity and picking list (input instructions)
-> inputinst.tbl - Changes in the inventory quantity of items (item time series)
-> itemtime.tbl
If we open the exported file "order.tbl" (the figure on the right is showing the file in MS-Excel), we can see that the due date is in column 5 and the Production End Time is in column 6.
Use the information in this file to create due date responses and work instructions.
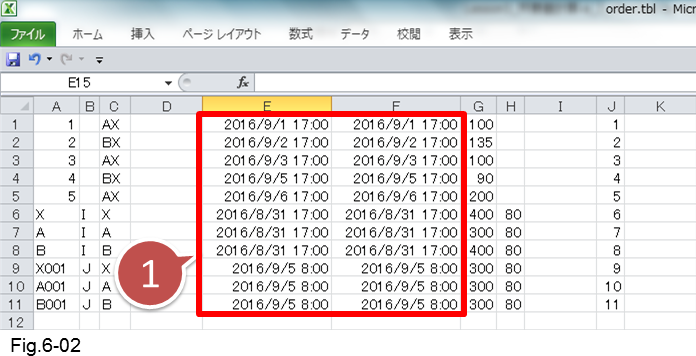
- For orders whose due date is delayed, the Asprova computed completion time (Production End Time) is later than the required due date. This plan will cause the order to be late.
6-2 Checking Warnings and Information That Require Adjustments
We checked and made adjustments to the schedule on the resource Gantt chart and inventory graph to avoid shortages, but we can also check using the input instruction table and item time series table.
■ Checking shortage information in the input instruction table
(1) To view the input instruction table, on the [Table View] menu, point to [Advanced Settings] and then click [Input Instruction].

- Click [Input Instruction] to display the input instruction table.
(2) The input instruction table is displayed. In this table, we can check the required quantity of each [Item] and [Time]. Rows whose [Remaining qty] is greater than zero signifies shortage.
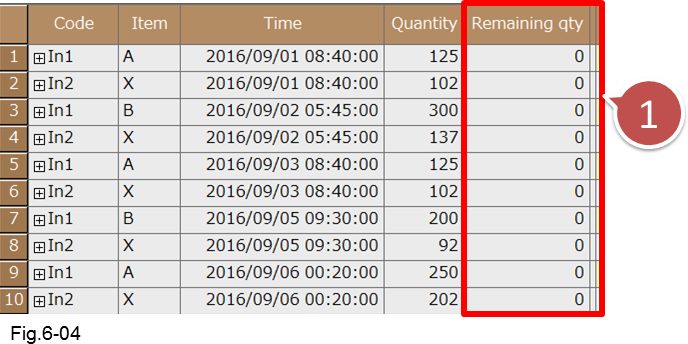
- Shortages can be verified with remaining qty.
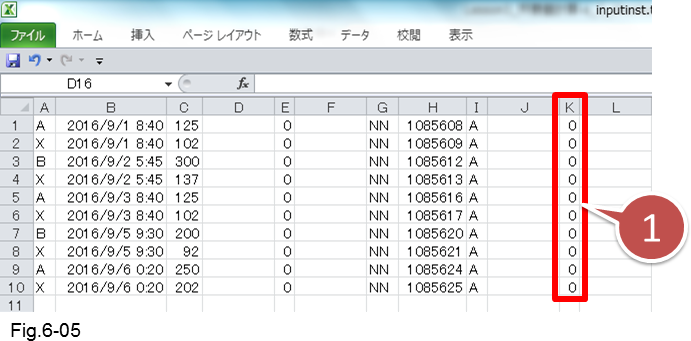
The input instruction table is exported to a file named "inputinst.tbl." The information in this file can be used to create picking lists, make due date adjustments with the person in charge of previous processes, make purchase requests, and so on.
- Be sure to check whether [Remaining qty] is greater than zero.
Checking shortage information using the item time series table
The item time series table enables you to check the changes in the inventory level in more detail.
(1) To display the item time series table, on the [Table View] menu, point to [Advanced Settings] and click [Item Time Series].
* Reschedule must be executed for this command to appear.

- Clicking [Item Time Series] displays the item time series table.
(2)In the item time series table, we can check the changes in the item inventory level by viewing the time and quantity values. If there is a shortage, the [Total qty] will become a negative number.

- If there is a shortage, Total qty becomes negative.
Related Materials
For more details, see the following materials.
■ Help
GUI Overview
http://lib.asprova.com/onlinehelp/en/AS2003HELP00656000.html
Table time chart windows overview
http://lib.asprova.com/onlinehelp/en/AS2003HELP00666000.html